Every tech salary discussion on the internet starts with Levels.fyi, Blind, or Glassdoor. And every one of those discussions overstates what the typical software developer actually earns.
That's not a criticism of those platforms (they're useful for company-specific data points). But they systematically over-represent FAANG compensation and under-represent the 1.4 million developers working at companies you've never heard of.
Here's what the actual data says.
The real numbers
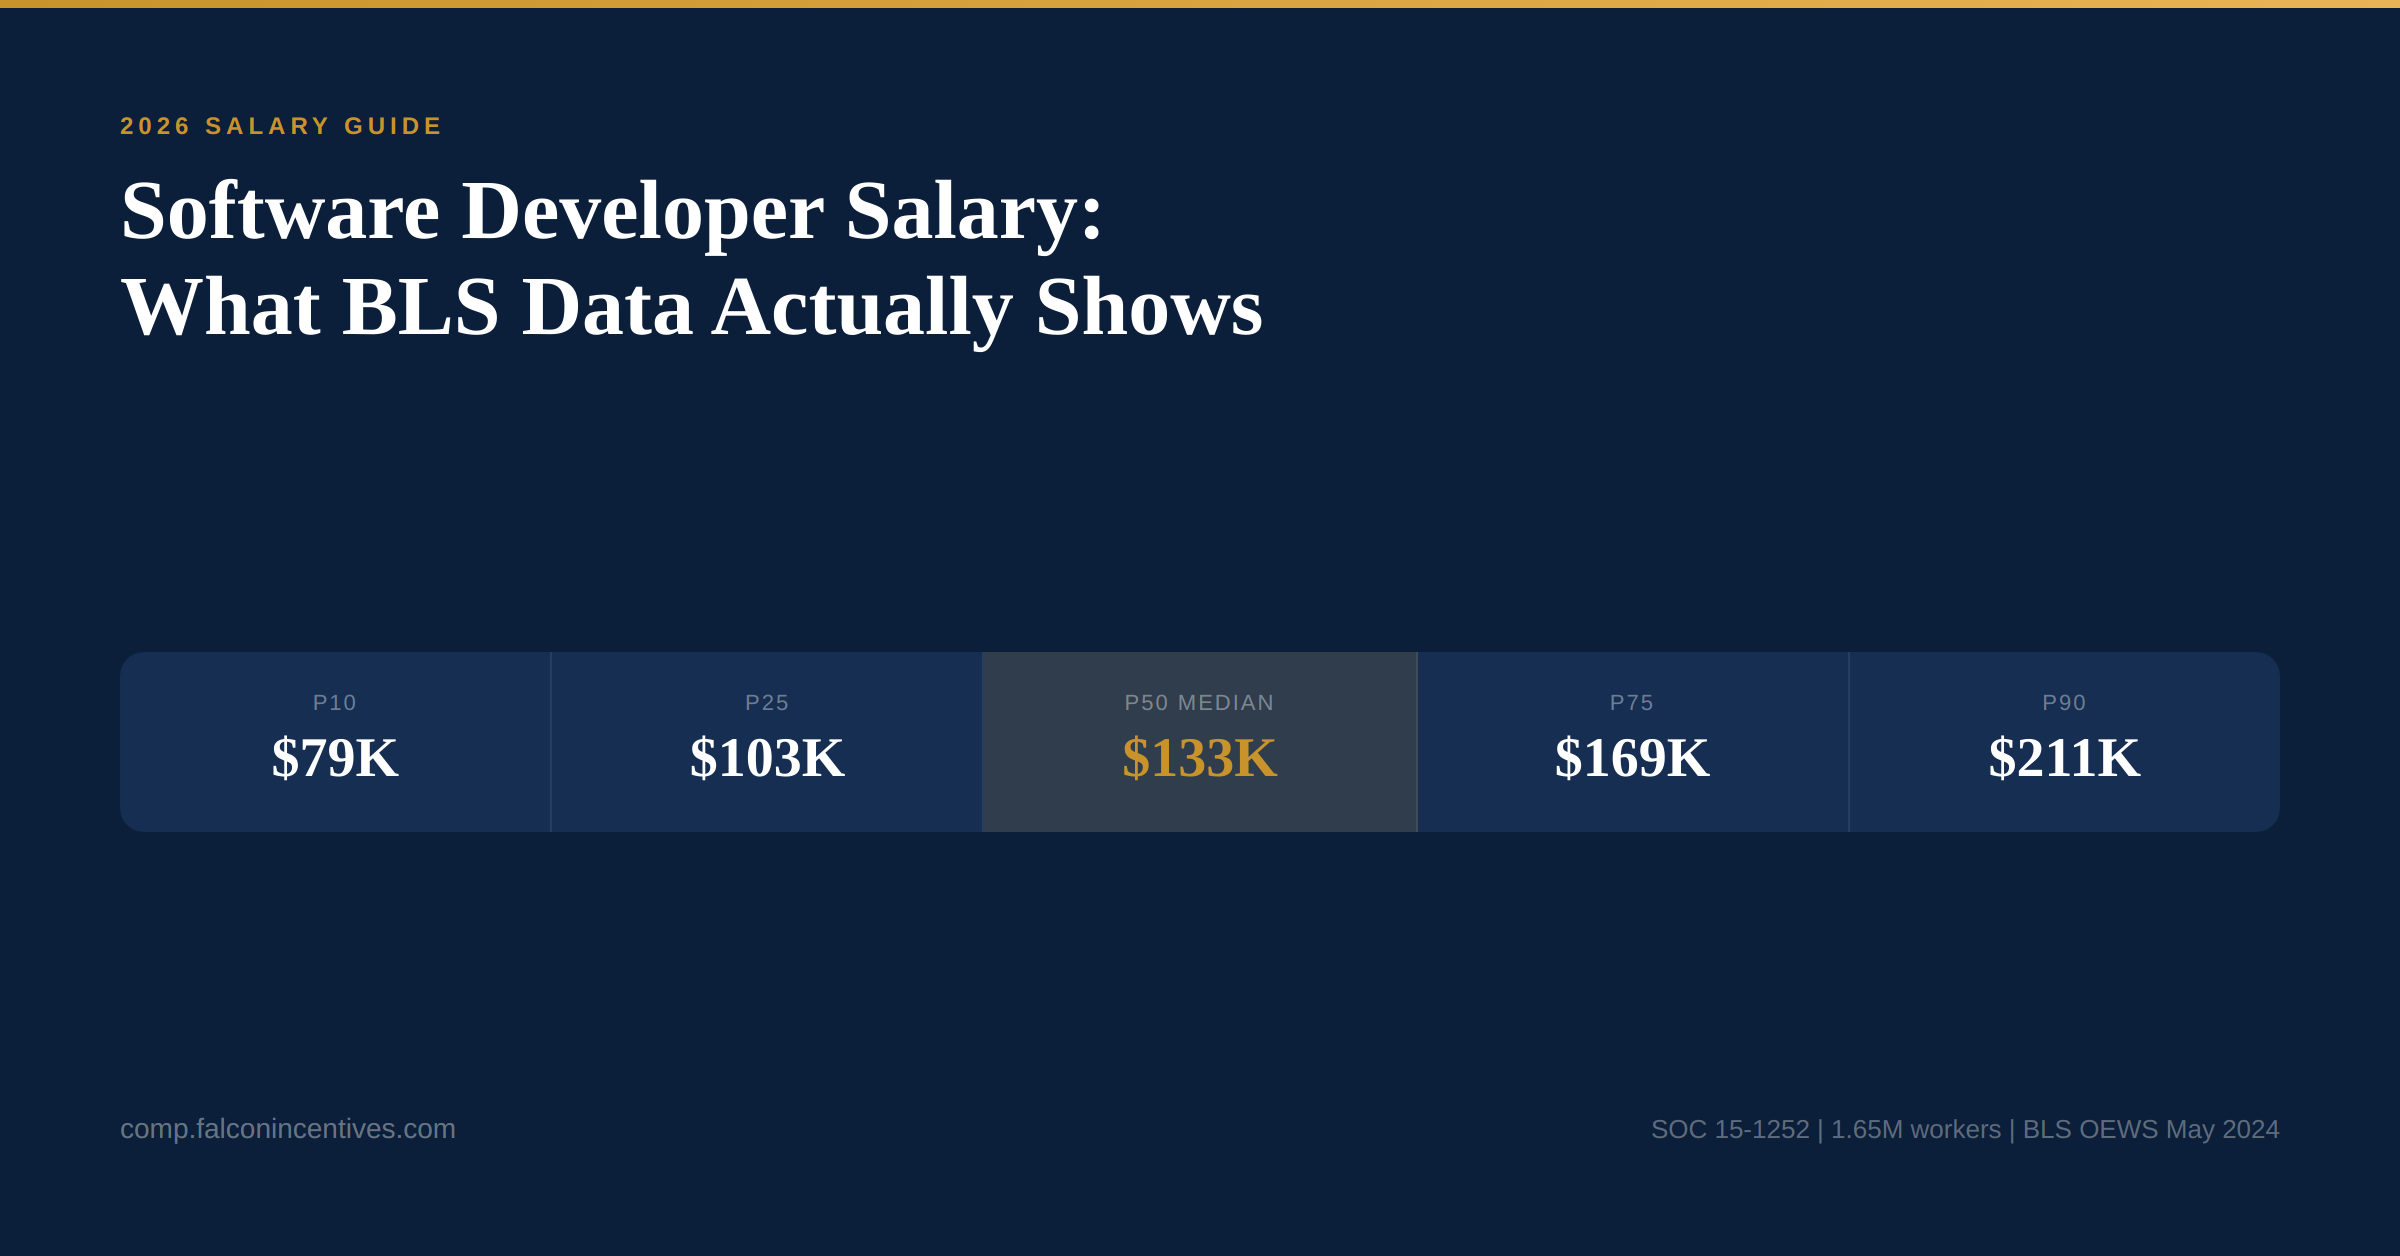
The Bureau of Labor Statistics tracks Software Developers (SOC 15-1252) across 1.1 million employer establishments. The May 2024 OEWS data (the most current release) shows:
| Percentile | Hourly | Annual |
|---|---|---|
| P10 (entry-level) | $38.39 | $79,851 |
| P25 | $49.55 | $103,064 |
| P50 (median) | $63.98 | $133,078 |
| P75 | $81.25 | $169,000 |
| P90 (top earners) | $101.66 | $211,453 |
Total employment: 1,654,440. This is one of the largest professional occupations in the country.
The median is $133,078. Not $160K. Not $180K. The majority of software developers in America earn well under what tech Twitter would have you believe.
Why the perception gap exists
The P90 is $211,453. That top decile (concentrated in San Francisco, Seattle, and New York, dominated by companies that pay in equity-heavy packages) is disproportionately visible online. They post on Blind. They share on Levels.fyi. They're the ones writing “I can't believe this is real” comp threads.
The median developer in Columbus, Ohio, or Raleigh, North Carolina, earns $130K base and doesn't post about it. They're not underpaid. They're just not in the echo chamber.
This matters for comp teams because if you benchmark to the echo chamber, you'll set ranges 20–30% above what most of the labor market actually pays. You'll either overpay relative to local market (fine if you're competing for SF talent) or price yourself out of budget when leadership looks at headcount costs.
Geographic variation
The BLS publishes state-level and metro-level data. The spread is significant:
- California: the highest concentration, with the San Jose-Sunnyvale metro pushing P50 well above $150K
- Texas: a rapidly growing market with Austin driving higher medians
- New York: NYC metro is strong, but upstate pulls the state average down
The state-level variation runs from roughly $100K in lower-cost states to $155K+ in California and Washington. That's a 55% spread for the same occupation code.
If you're setting national pay bands, you need to decide: are you paying for the role or for the zip code? The BLS data lets you see both.
The JOLTS signal: what's happening in tech hiring right now
According to the latest JOLTS data (February 2026), the Information sector (the closest BLS proxy for tech) shows:
- Openings rate: 2.2% (down significantly from the 2022 peak of 5.5%)
- Quits rate: 1.3% (the lowest in a decade)
- Signal: Cooling
This is the “Great Stay” in action. Tech workers aren't quitting. They're staying put in a tighter market, which means employers have more leverage than at any point since pre-2020.
For comp teams, the implication is clear: you don't need to stretch offers as aggressively as you did in 2021–2022. The market has normalized. Let the BLS data, not FOMO, set your ranges.
How to use this data
- Start with the BLS median ($133K nationally) as your midpoint, not Glassdoor's inflated range.
- Adjust for geography using state or metro-level data in CompSignal.
- Layer in the JOLTS signal: a cooling market means candidates have less leverage, not more.
- Save the Levels.fyi data for FAANG-specific competitive analysis, not general benchmarking.
The best comp decisions start with the most reliable data source and adjust from there. The BLS survey of 1.1 million establishments is that source.
Look up your market. Open CompSignal: free P10–P90 wage data for Software Developers in any metro.
CompSignal is built by Falcon Incentives, a compensation strategy consultancy for mid-market companies.