If you're an HR professional evaluating a relocation, negotiating a remote work arrangement, or benchmarking your own pay, the question “what do HR people earn in my state?” matters.
The problem is that most salary comparison sites give you a single number with no source and no context. Here's what the Bureau of Labor Statistics actually publishes, based on employer-reported payroll data from 1.1 million establishments.
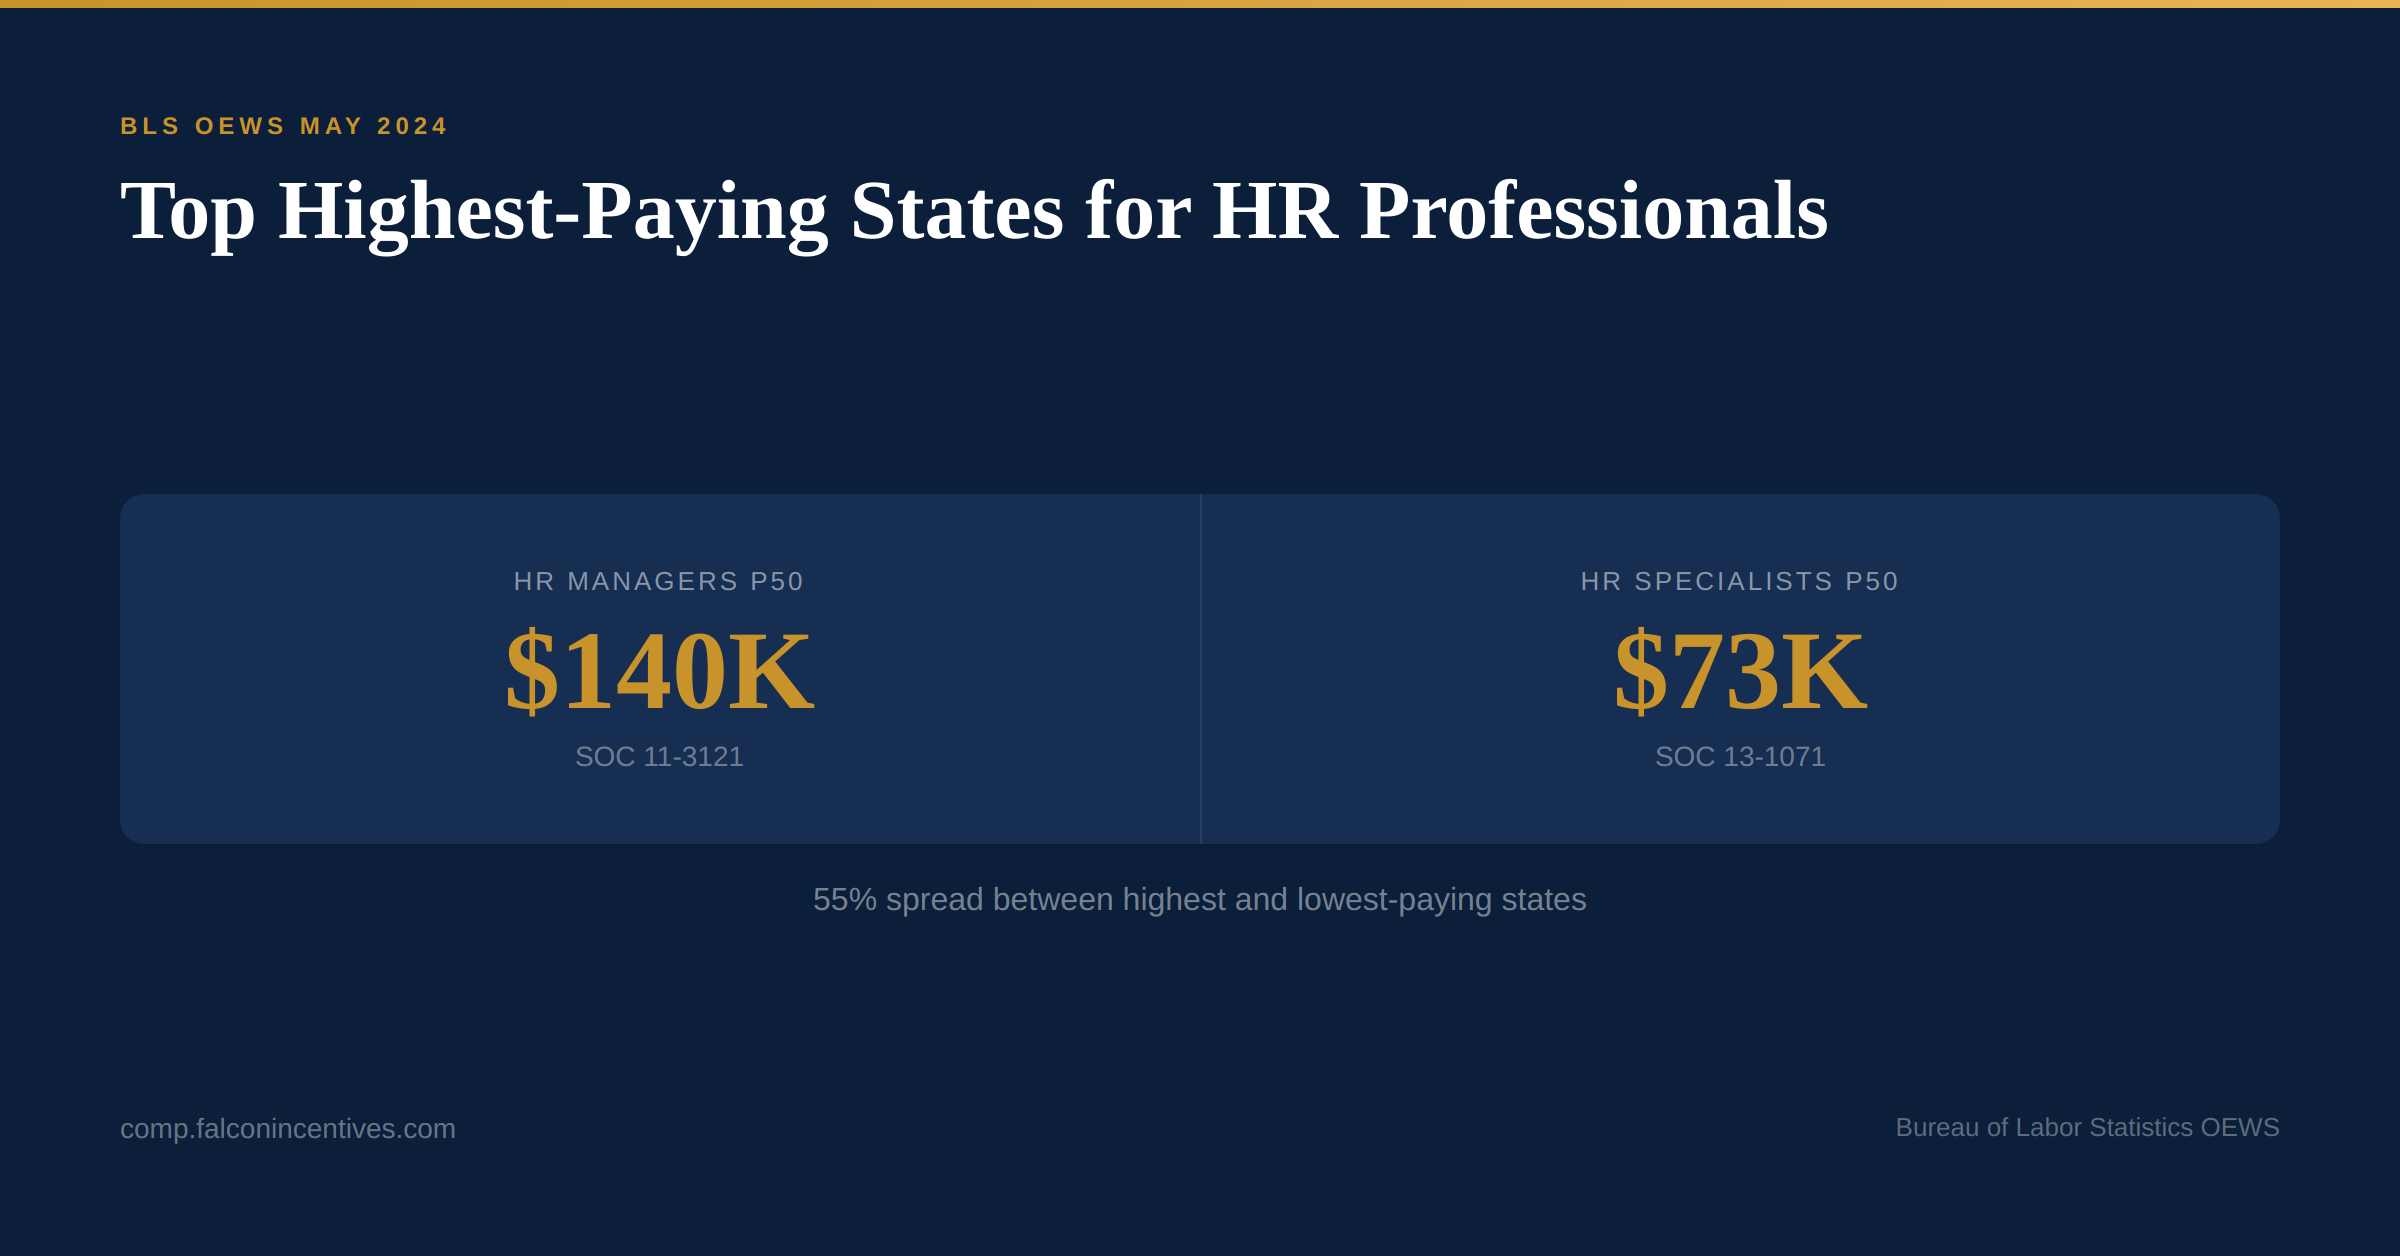
HR Managers (SOC 11-3121)
The national median for HR Managers is $140,026 per year ($67.32/hr). But the state-level variation is dramatic.
The highest-paying states for HR Managers cluster in two patterns: high-cost coastal metros (New York, California, New Jersey) and states with concentrated corporate headquarters (Connecticut, Massachusetts). The lowest-paying states (Mississippi, Arkansas, West Virginia) pay 20–25% below the national median.
For HR professionals considering a move, the math isn't as simple as “highest salary = best deal.” A $155K HR Manager salary in New Jersey goes less far than $130K in Georgia once you account for cost of living, state income tax, and housing. The BLS data tells you the market rate. Your personal equation adds the cost adjustments.
Check your state in CompSignal: select your geography to see the full P10–P90 range with cost adjustments.
HR Specialists (SOC 13-1071)
HR Specialists (the backbone of most HR departments) have a national median of $72,904 per year ($35.05/hr). The state variation follows the same coastal/heartland pattern but with a tighter spread.
The P10–P90 range nationally runs from $45,448 to $126,547, which is an enormous 178% spread. That tells you something important: “HR Specialist” covers everything from a benefits coordinator at a 50-person company to a senior HRBP at a Fortune 500. The title is broad, the pay range is broader.
If you're benchmarking HR Specialist roles for your organization, the national median is less useful than the percentile your role should sit at. A generalist processing I-9s is a P25–P40 role. A specialist running the annual compensation review cycle is P60–P75. Same SOC code, very different market rate.
The geographic premium question
When your CEO asks “why does our California HR Manager cost $155K when the same role in Ohio is $120K?”, the BLS data gives you the answer: because that's what every employer in California pays. It's not your HR Manager being overpaid. It's the market.
This is where the BLS advantage over self-reported data is most clear. Glassdoor might show you a single number that mixes San Francisco and Sacramento, remote and on-site, HR Managers and “People Managers” (not the same SOC). The BLS separates all of this cleanly.
What to do with this data
- Benchmark your own comp. Look up your role + state in CompSignal. If you're below P25, you're meaningfully underpaid relative to the market. If you're above P75, you're in a strong position.
- Set geographic differentials with data. If your company has offices in multiple states, use the state-level P50 ratios to set location-based pay bands instead of arbitrary cost-of-living multipliers.
- Prepare for remote work negotiations. When a candidate asks “will you pay Bay Area rates for a remote role?”, the BLS data shows you exactly what the delta is between markets. You can make a transparent, data-backed offer: “We pay at the P50 of your location, which is…”
Look up HR salaries in your state. Open CompSignal: free, no account required.
CompSignal is built by Falcon Incentives, a compensation strategy consultancy for mid-market companies.