You just approved an offer at the 60th percentile. Your comp committee signed off. The candidate accepted.
But whose 60th percentile was that?
If the answer is Glassdoor, LinkedIn Salary, or Payscale, you might have a problem. Not because those platforms are useless (they aren't) but because the data they collect has structural flaws that most HR teams never think about. And those flaws compound every time you make a pay decision based on them.
The problem with self-reported salary data
Self-reported salary platforms work by asking individuals to submit their compensation. This creates four systemic biases:
1. Selection bias. People who submit salaries skew toward two groups: those who are proud of what they earn (high earners) and those who are frustrated (job seekers researching whether they're underpaid). The middle, the quiet majority who feel adequately compensated, rarely bothers. This inflates the reported median.
2. Title inflation. A “Senior Software Engineer” at a 15-person startup and a “Senior Software Engineer” at Google are not the same role. Self-reported platforms can't standardize for this. The Bureau of Labor Statistics uses the Standard Occupational Classification (SOC) system, which groups roles by what people actually do, not what their business card says.
3. Stale submissions. Glassdoor doesn't expire old salary reports. A submission from 2021 sits alongside one from 2025. In a market where wages grew 15-20% in many sectors post-pandemic, mixing vintages makes the average meaningless.
4. No employer verification. Nobody checks whether a self-reported salary is base, total cash, or total comp including equity. A software developer reporting “$180,000” might mean base salary, or might be including $50K in RSUs. The platform has no way to know.
What the numbers actually look like
Let's compare. Here's what the Bureau of Labor Statistics reports for four common roles, based on their May 2024 OEWS survey of 1.1 million employer establishments:
| Role | BLS Median (Annual) | What you typically see on Glassdoor |
|---|---|---|
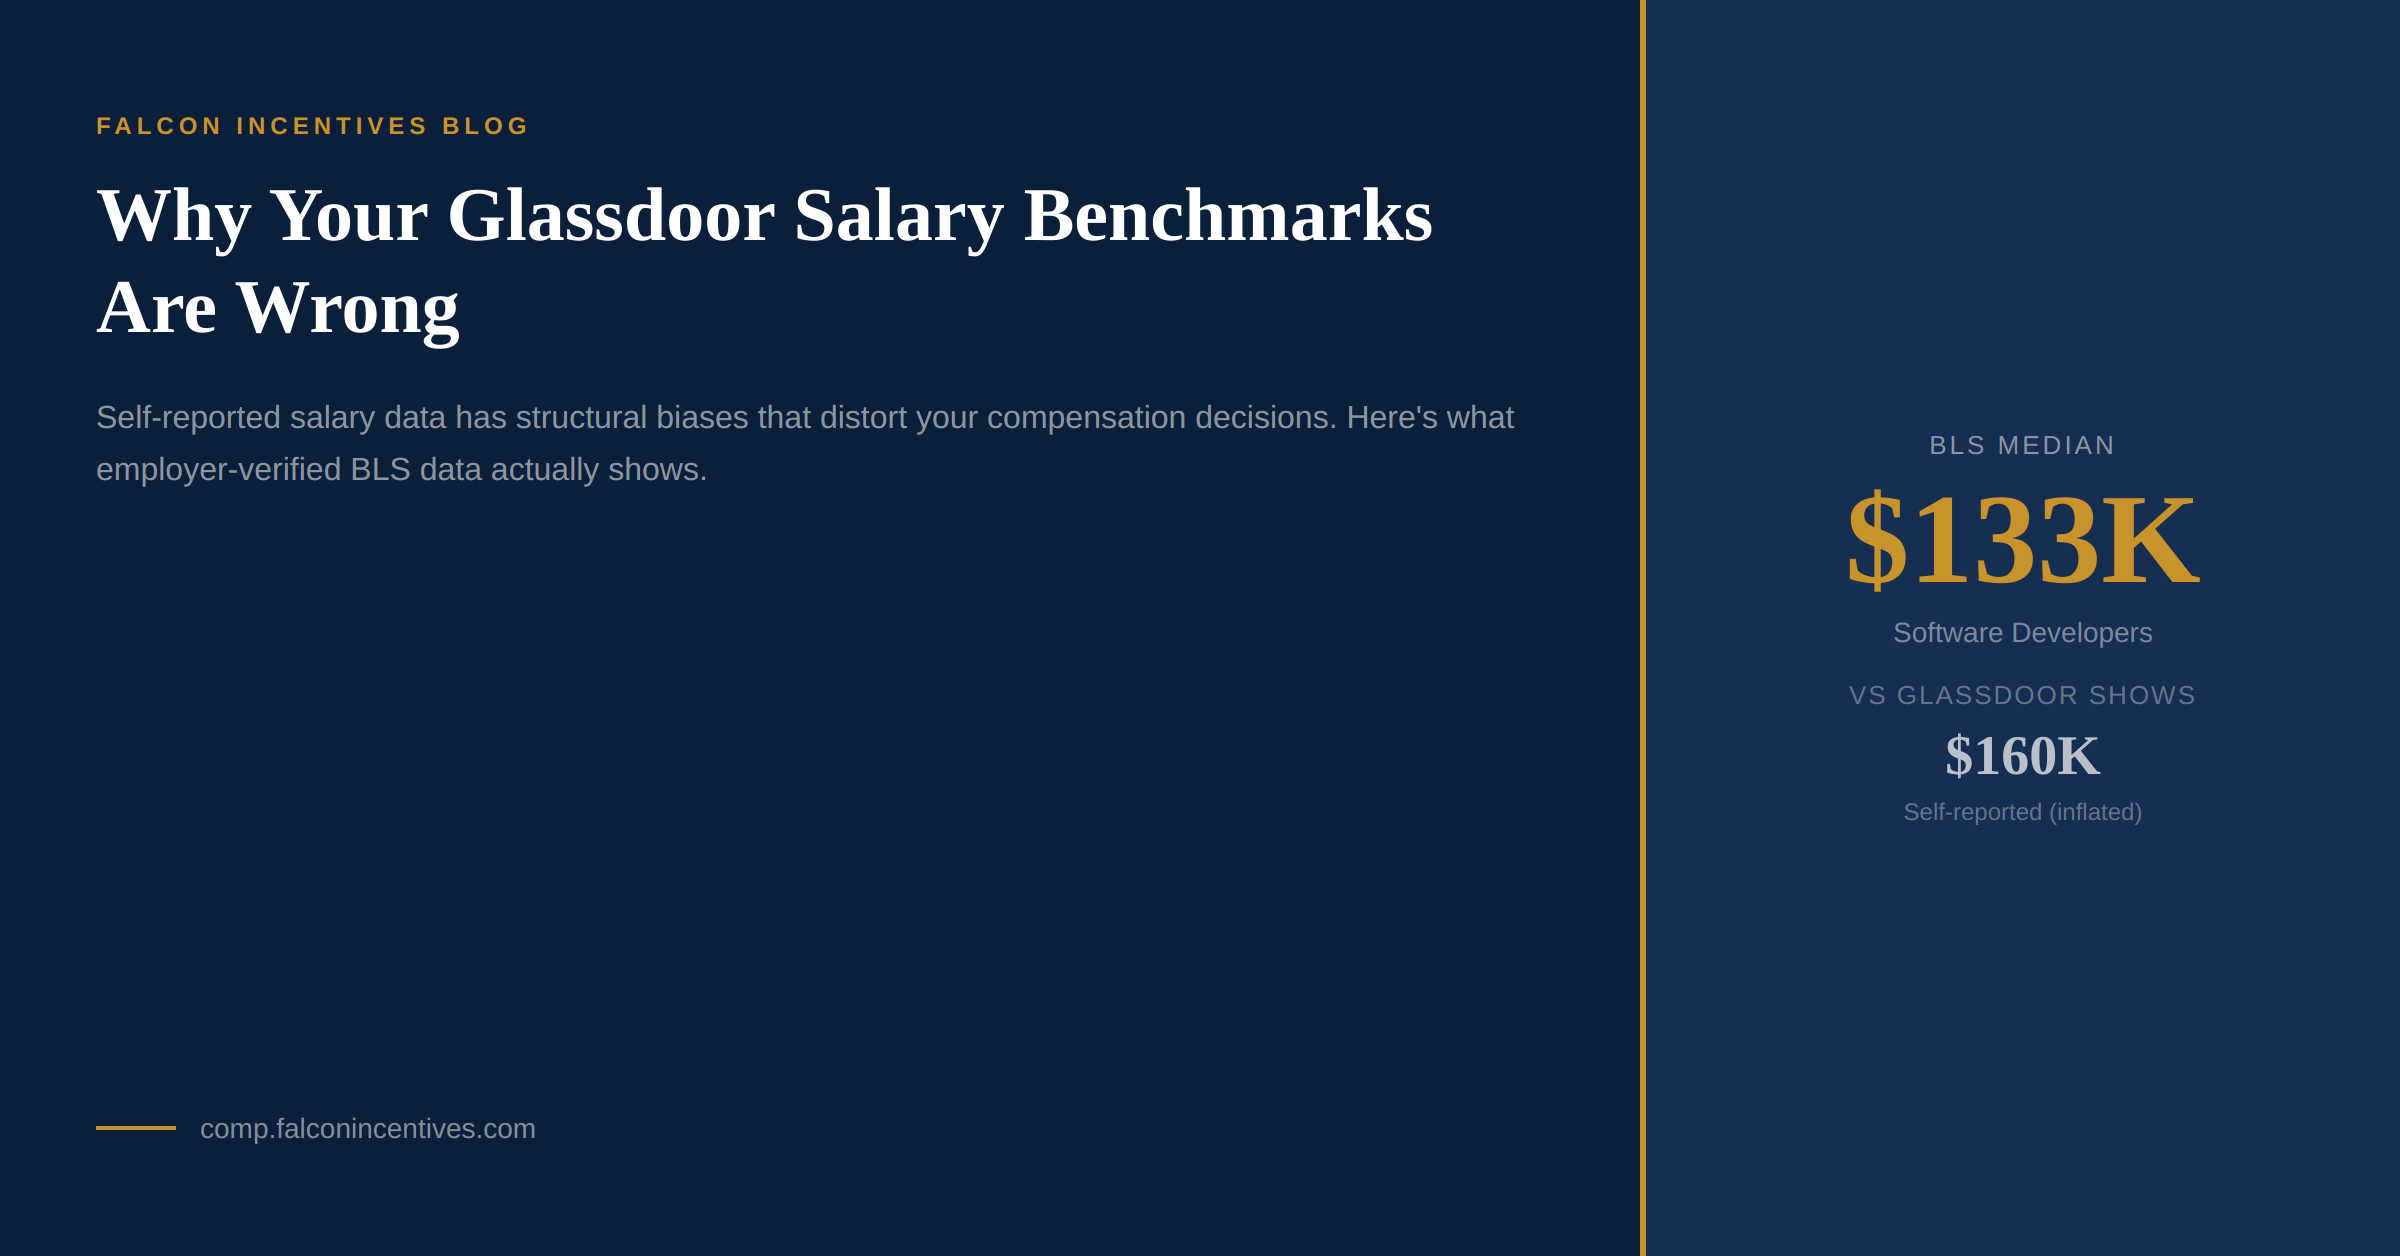
| Software Developers | $133,078 | $140,000–$160,000 |
| Registered Nurses | $93,600 | $75,000–$95,000 |
| HR Managers | $140,026 | $100,000–$130,000 |
| HR Specialists | $72,904 | $55,000–$70,000 |
Notice the pattern: Glassdoor tends to overstate tech salaries (because high earners at FAANG companies dominate submissions) and understate non-tech professional roles (because those workers are less likely to post on a tech-centric platform).
If you're benchmarking an HR Manager offer using Glassdoor, you might set the range at $100K–$130K and think you're being competitive. The BLS says the actual median is $140K. You'd be offering below the 50th percentile while thinking you're at it.
Why BLS data is different
The Bureau of Labor Statistics doesn't ask workers what they earn. It asks employers what they pay. And it's not optional.
The Occupational Employment and Wage Statistics (OEWS) survey covers approximately 1.1 million employer establishments across every industry and geography in the United States. Employers report actual payroll data, classified by standardized occupation codes (SOC). The BLS then publishes percentile distributions (P10, P25, P50, P75, P90) for each occupation at national, state, and metropolitan levels.
This matters for three reasons:
- Employer-reported = verified. The numbers come from payroll systems, not memory or aspiration.
- SOC standardization. A Software Developer (SOC 15-1252) is defined by job duties, not title. This eliminates the “Senior Engineer at a startup” problem.
- Full distribution. You don't just get a median. You get the P10–P90 range, which tells you what entry-level, mid-career, and top-of-market pay actually looks like.
The honest tradeoff
BLS data isn't perfect either. It's published annually (the current release covers May 2024), so it lags real-time market shifts by 6–12 months. It doesn't capture equity compensation, signing bonuses, or benefits, just hourly/annual wages.
The right approach isn't choosing one or the other. It's using BLS as your foundation (the employer-verified, statistically rigorous baseline) and then adjusting with self-reported data for real-time signals on specific companies or roles where BLS granularity isn't enough.
Start with the floor truth. Then layer on market color.
How to use this in practice
CompSignal makes BLS data searchable and actionable. You can benchmark any of 755+ occupations across 393 metro areas, see P10–P90 wage percentiles, and compare geographies. All free, no account required.
Here's a practical workflow for your next comp decision:
- Start with CompSignal: look up the SOC code for the role, check the P50 and P75 in the relevant metro.
- Check the distribution: is the role concentrated at a narrow pay band (P10–P90 spread under 50%) or wide? Narrow means the market has consensus; wide means experience and specialization matter more.
- Layer in self-reported data: check Glassdoor or Levels.fyi for company-specific data points, but weight them lower than the BLS baseline.
- Document your methodology: when the comp committee asks “where did this number come from?”, you want to say “Bureau of Labor Statistics” before “Glassdoor”.
The BLS isn't exciting. It doesn't have company logos or salary negotiation tips. But it's the same primary source that Mercer, Radford, and Willis Towers Watson cross-reference in their $50,000/year enterprise surveys. You just don't need to pay for it anymore.
Benchmark any role free. Open CompSignal: 755+ occupations, 393 metros, real BLS data.
CompSignal is built by Falcon Incentives, a compensation strategy and incentive design consultancy for mid-market companies.